
Pinpoint Precision. Before the Opening Bell.
One Proprietary Methodology.
Discover the Power of Knowing Your Levels Before the Opening Bell.
See how Michael’s proprietary Long/Short Line and predefined structural levels provide a framework for evaluating the New York trading session.
Ready to have Michael’s Daily Levels available on your NinjaTrader charts?
Subscribe Now →Trading futures involves substantial risk. Historical examples are selected illustrations and do not establish an overall accuracy rate or guarantee future trading results.
The Long/Short Line: A Different Perspective on Market Direction
At the heart of Michael’s Daily Levels is the proprietary Long/Short Line, a predefined reference designed to help traders assess directional bias during the New York trading session.
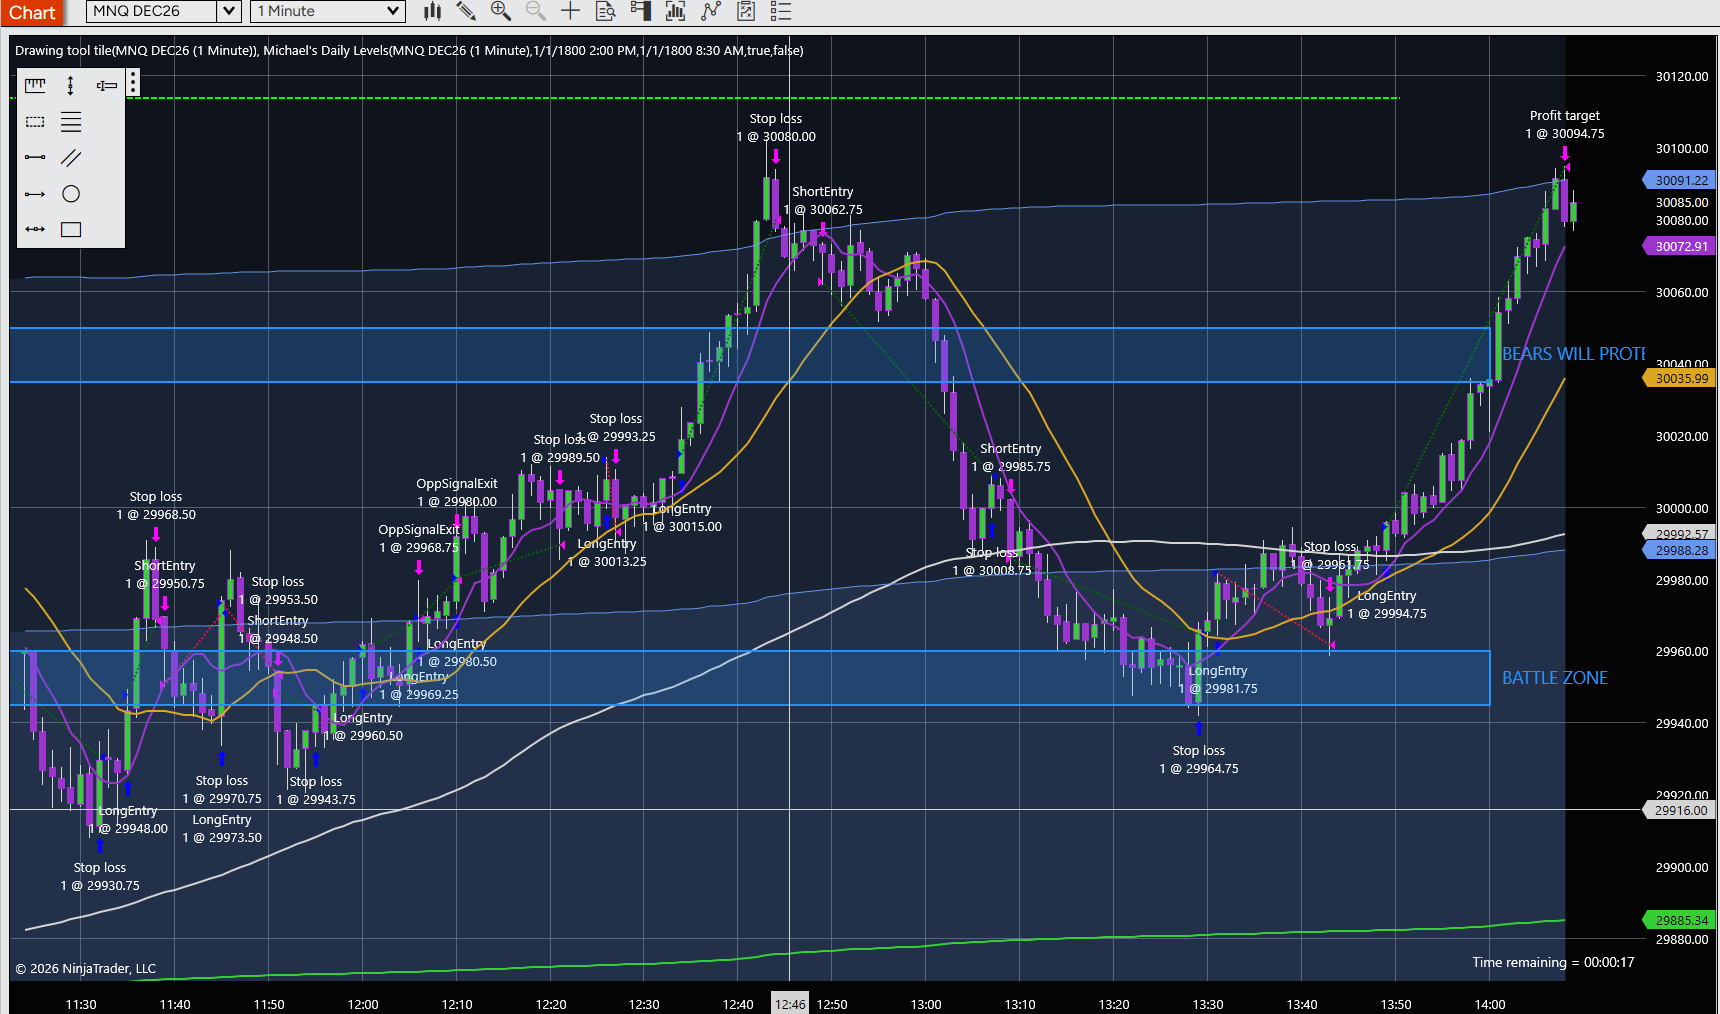
Rather than waiting until a significant move has occurred, subscribers begin the session with an established reference against which subsequent price action can be evaluated. Historical examples illustrate instances of remarkably precise price reactions around this line.
It is a directional reference—not a prediction or guarantee of market direction or profitable trades.
Four Years of Research. Thousands of Charts.
Michael’s Daily Levels grew out of more than four years of independent study of thousands of Nasdaq futures charts, observing recurring market structures and refining a proprietary approach to significant price zones.
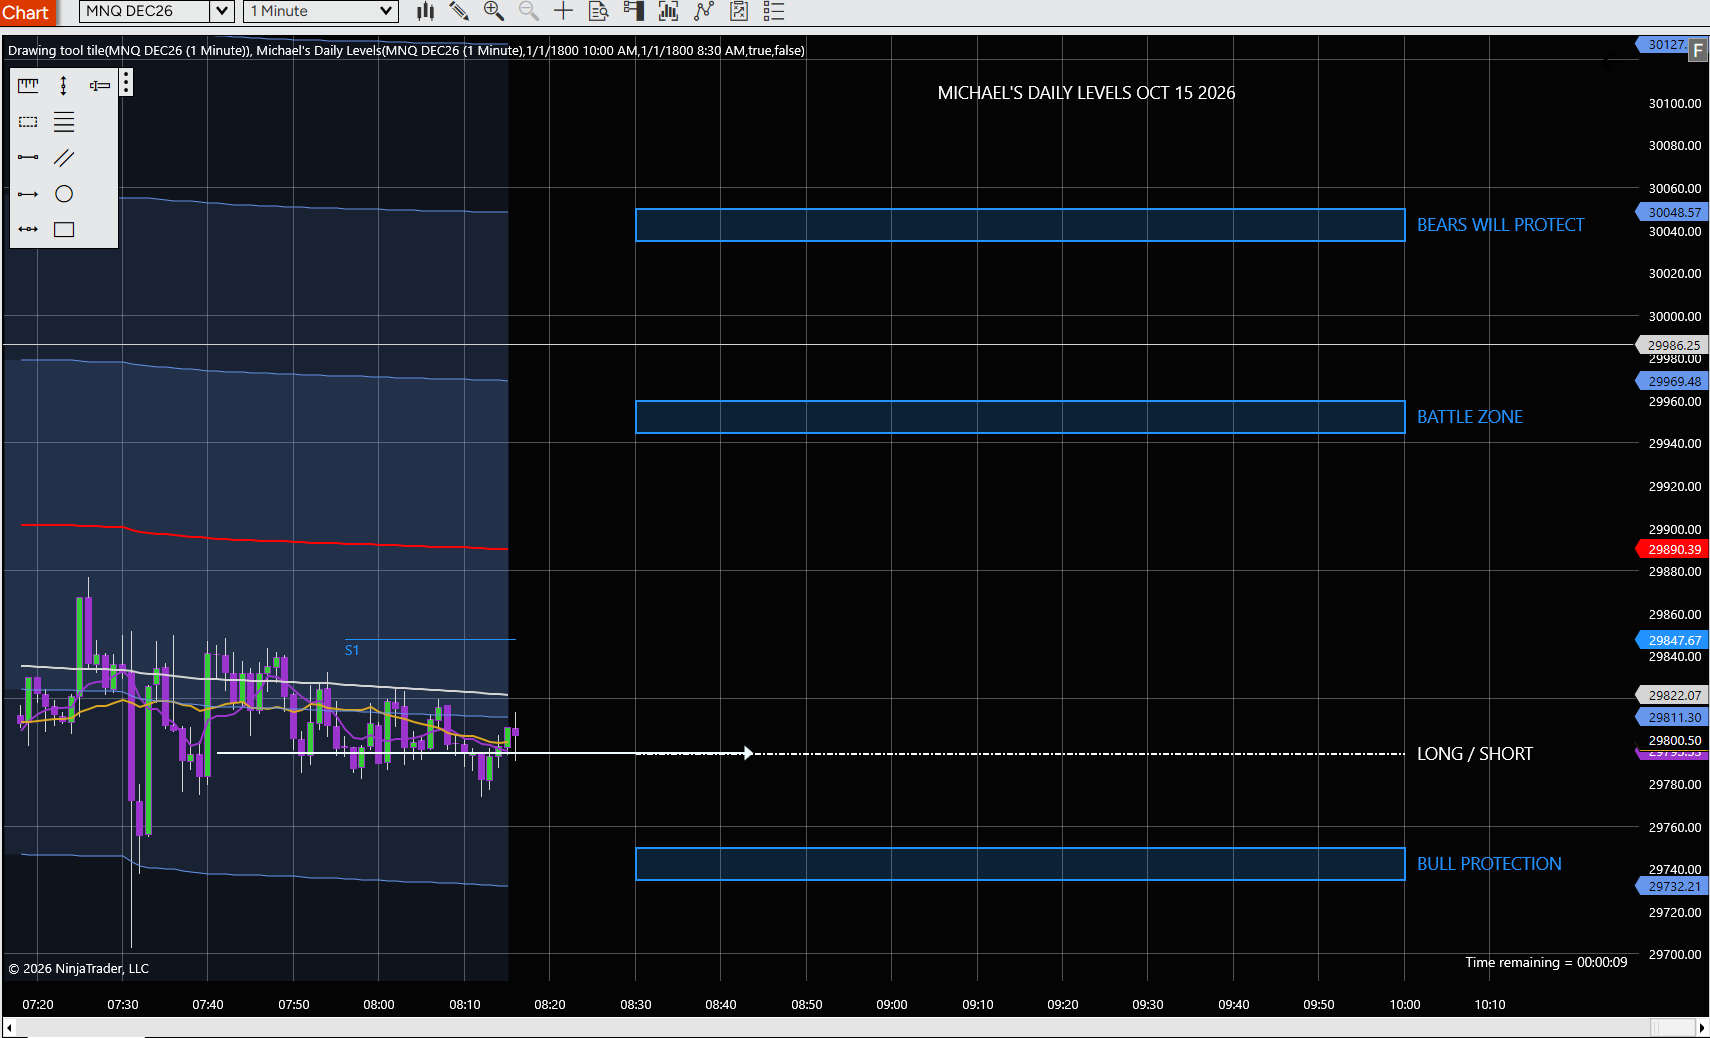
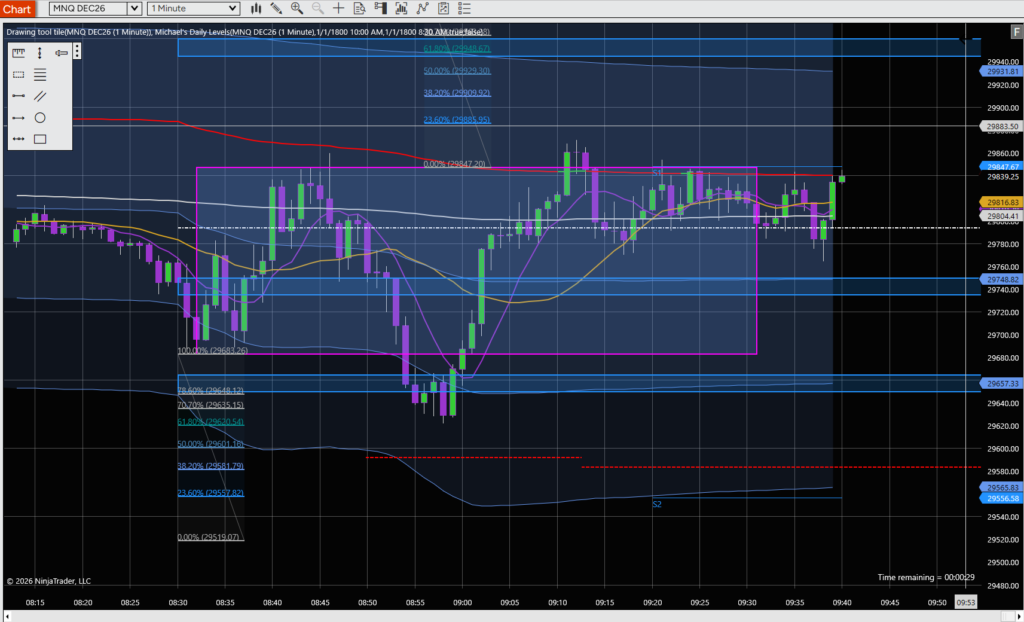
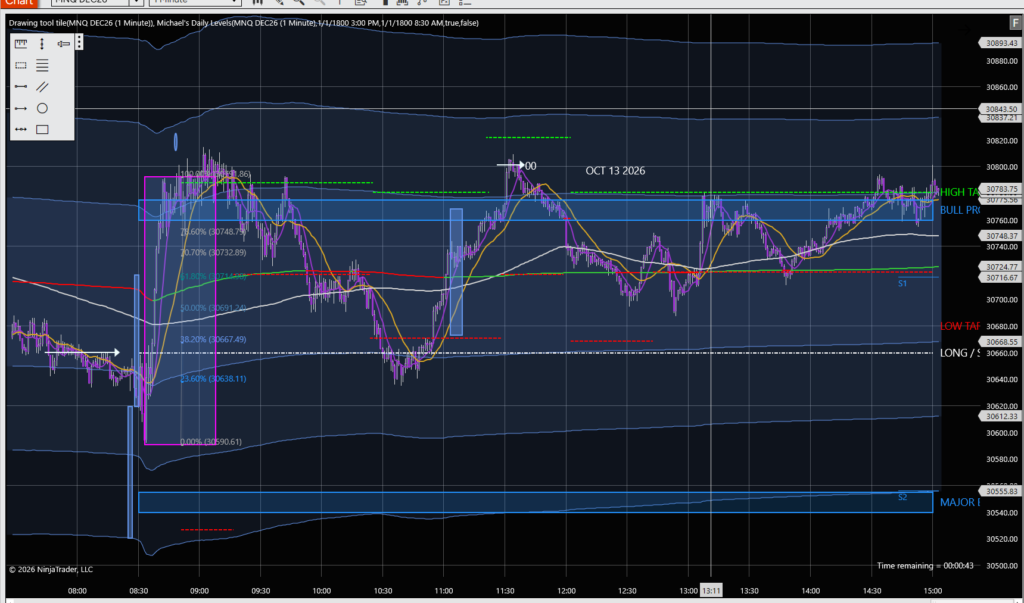
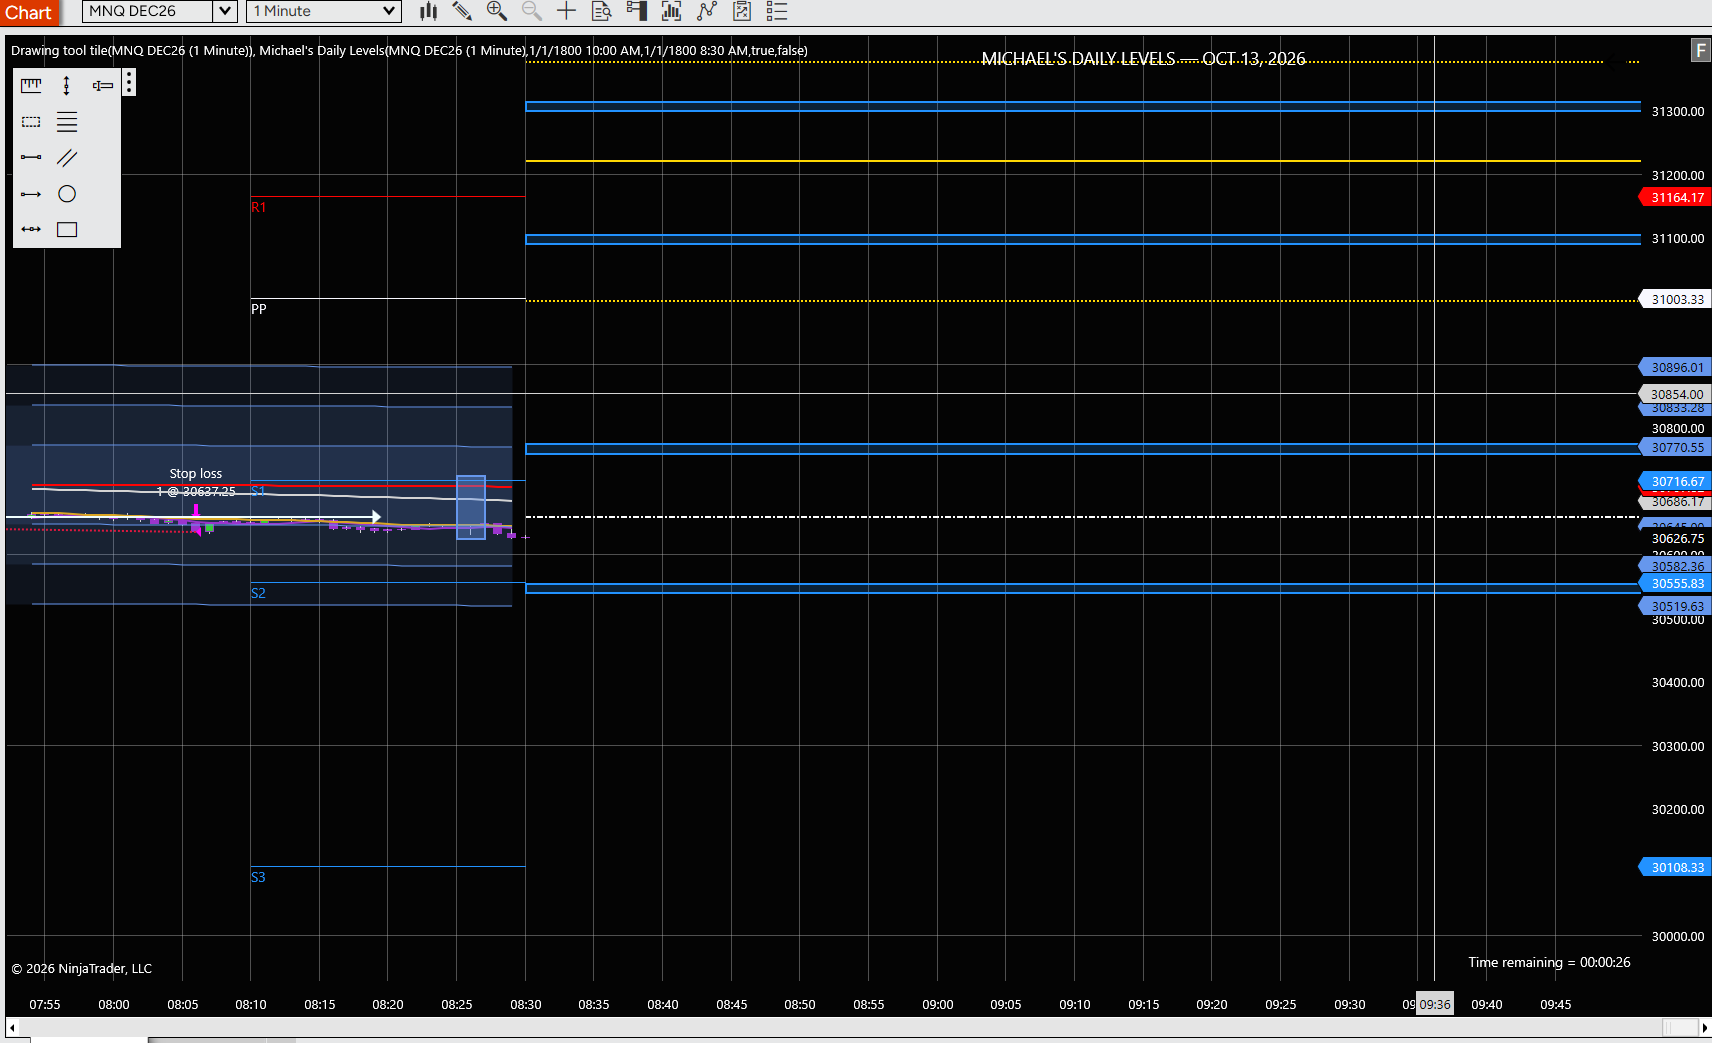
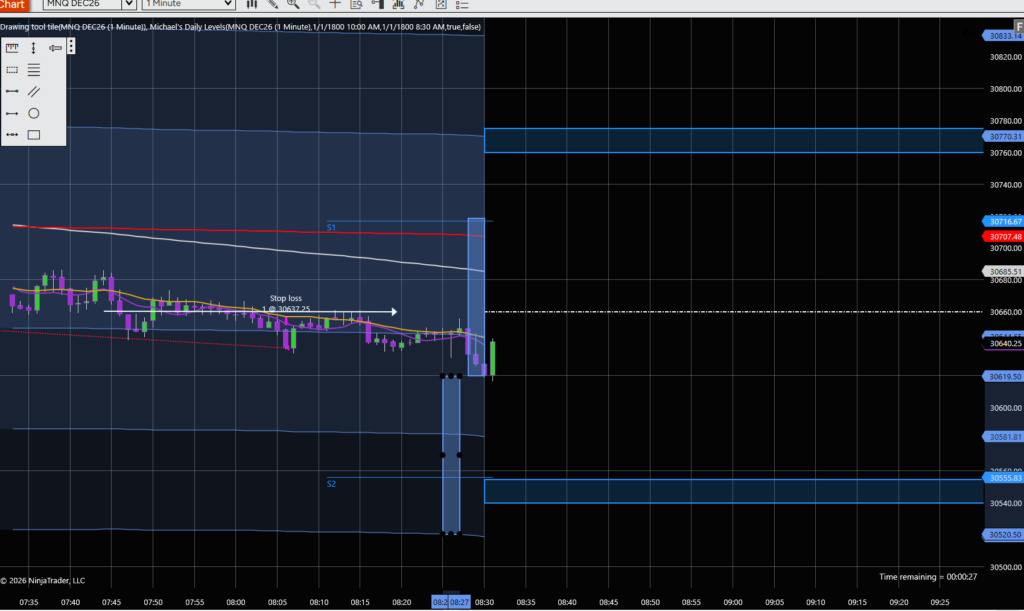
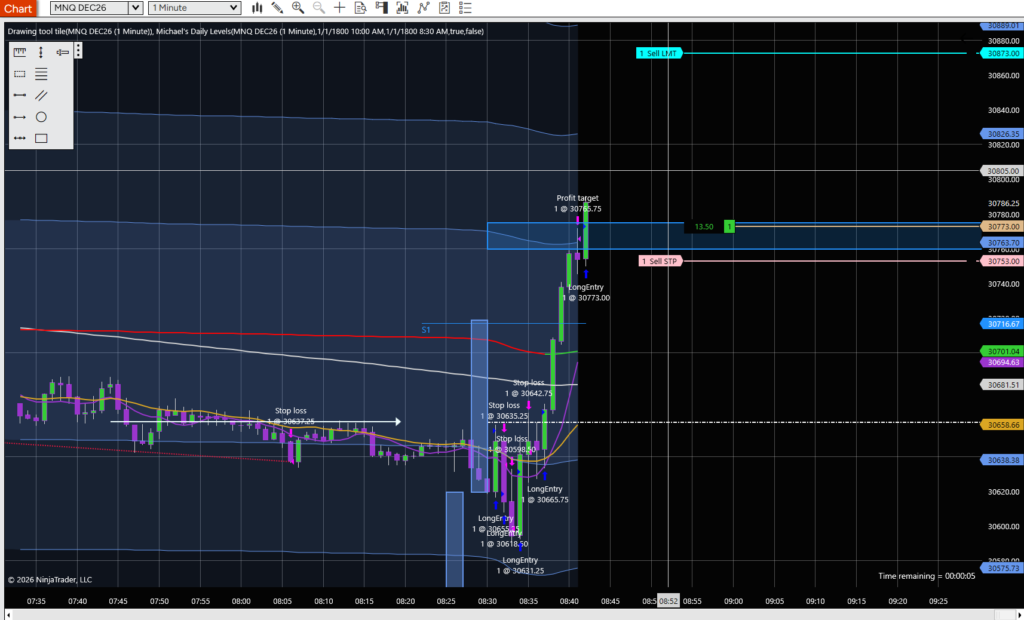
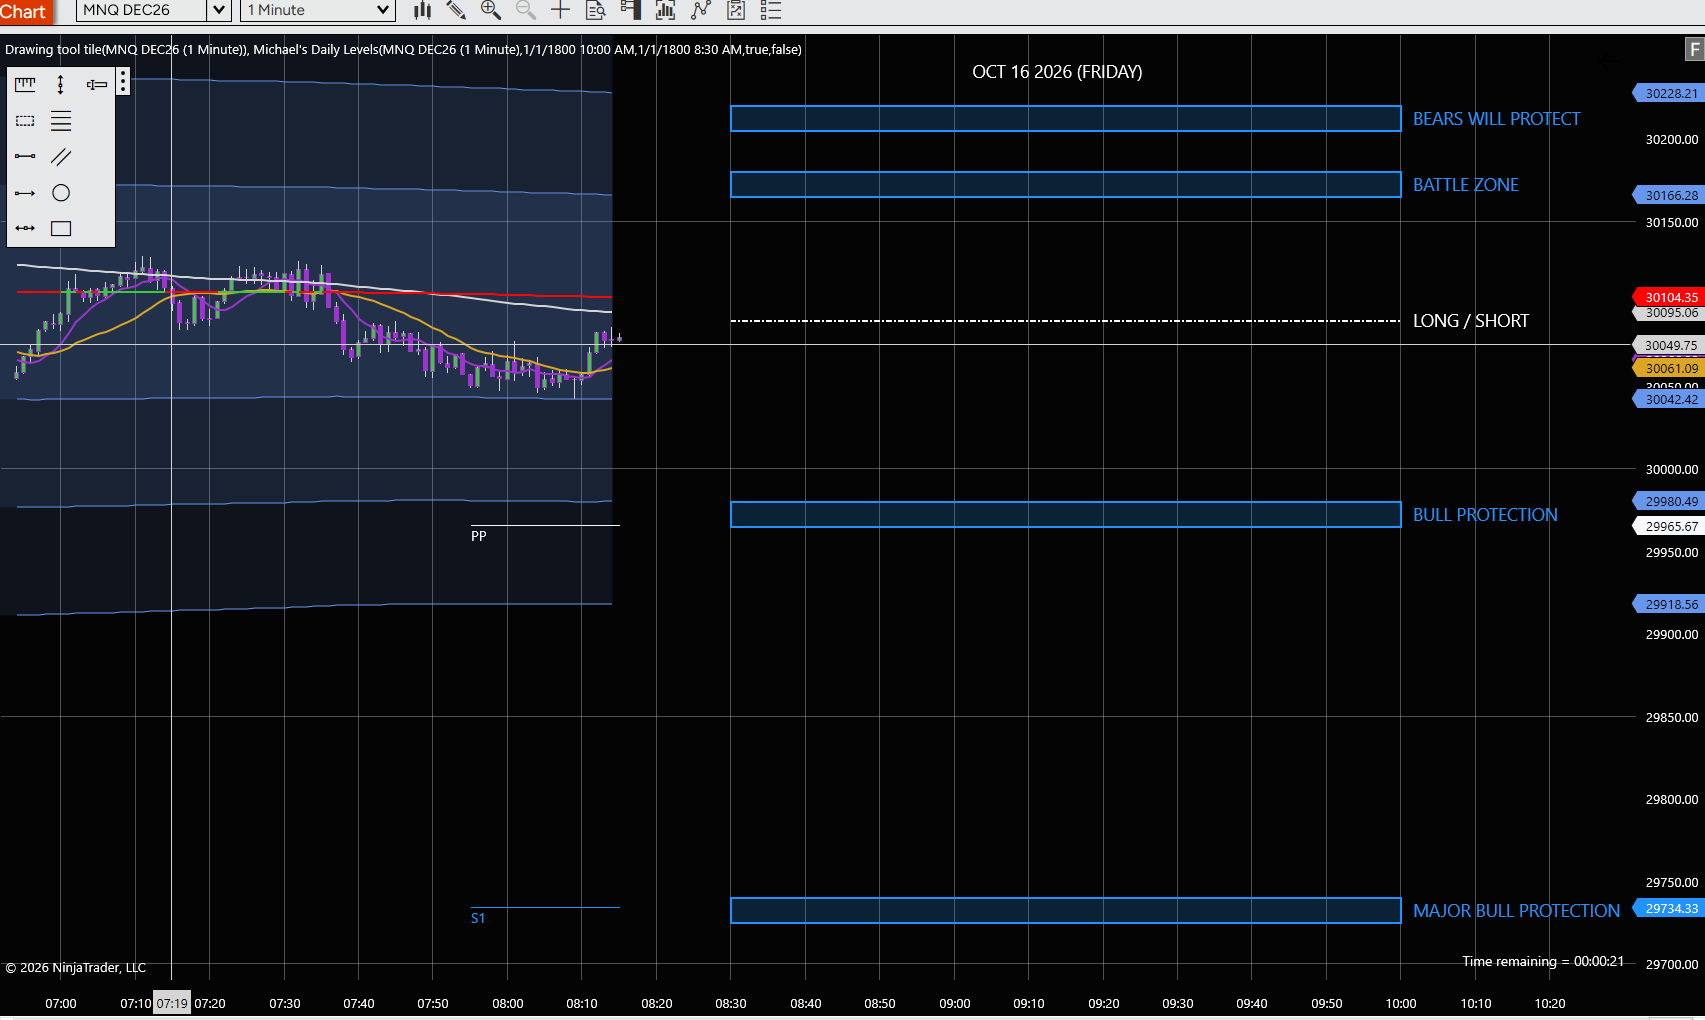
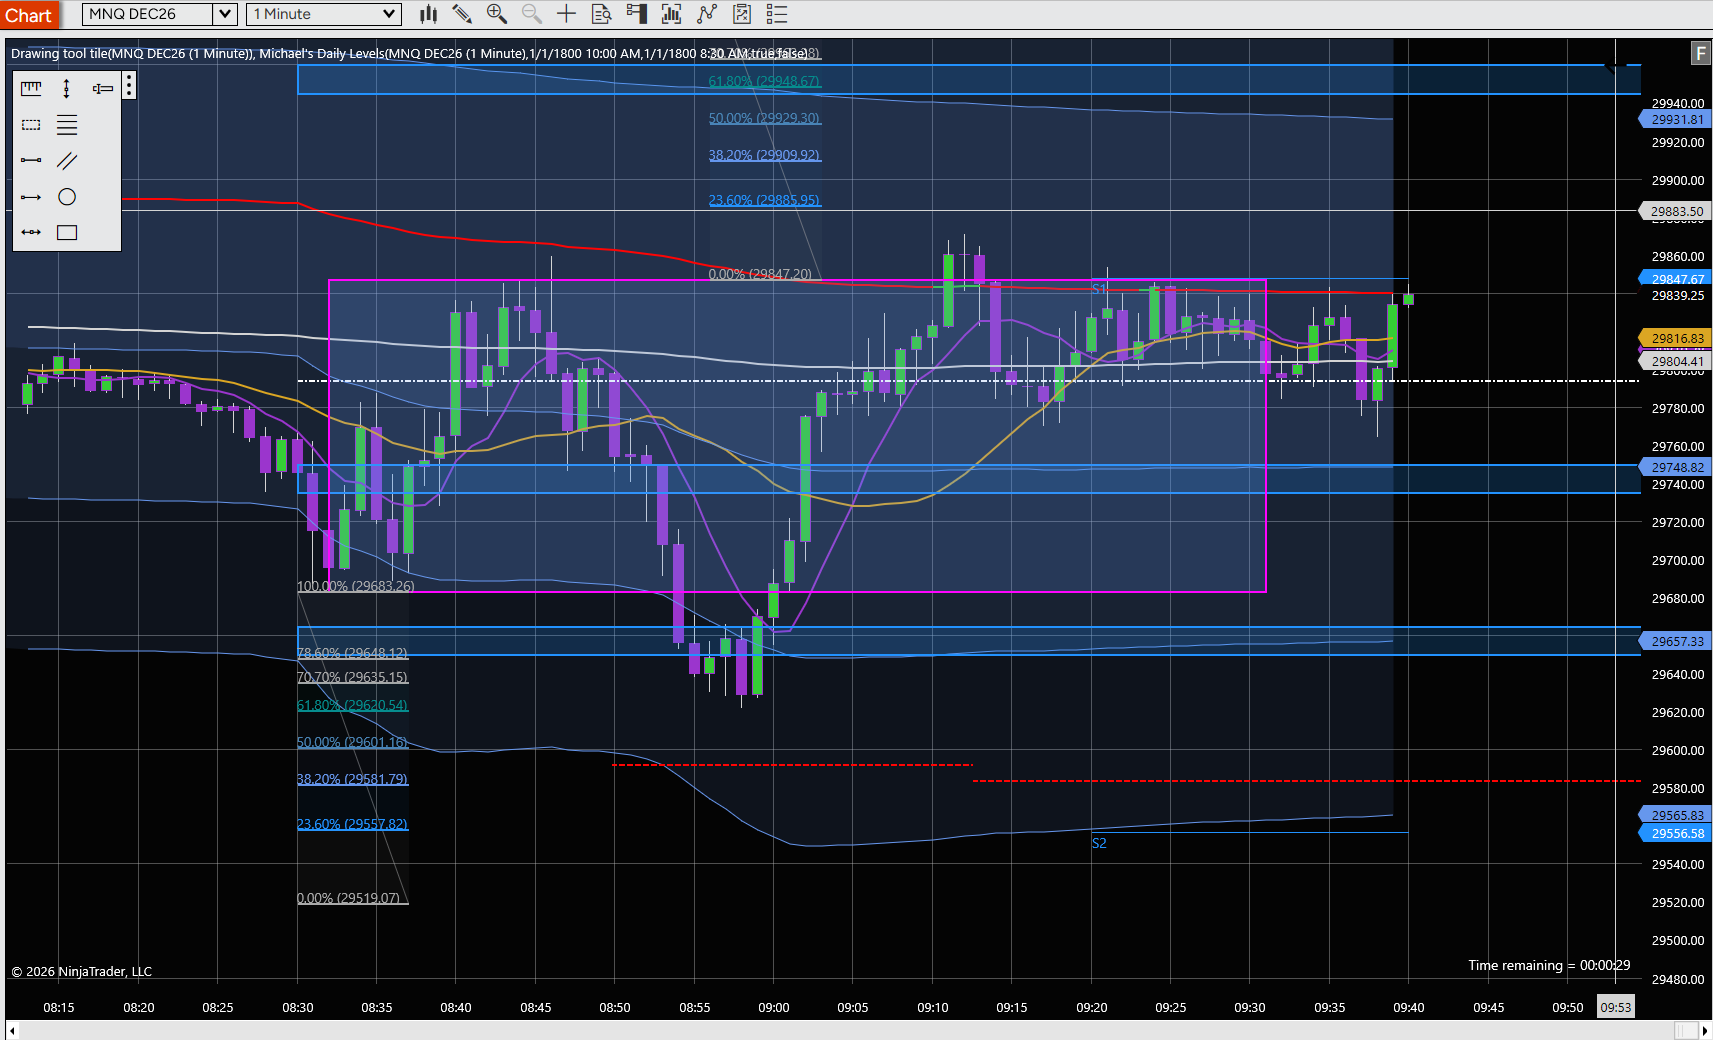
The levels are established before the New York session. The gallery below lets you examine selected historical examples of what price did afterward—not levels drawn retrospectively to fit a completed chart.
These are selected examples, not a complete record of every session, and they should not be interpreted as a statistical measure of accuracy.
Get Michael’s Daily Levels delivered directly to your NinjaTrader charts before the New York trading session begins.
Subscribe to Michael’s Daily Levels →Historical Chart Gallery
Explore how price interacted with predefined structural zones and the Long/Short Line. Click an image to view the chart in detail.
Historical examples for education and illustration only. Not current trading signals.
Ready to Trade with Greater Preparation?
Receive Michael’s Daily Levels directly on your NinjaTrader charts before the New York session begins.
Subscribe Now →Futures Risk Disclosure
Futures and forex trading contains substantial risk and is not for every investor. An investor could potentially lose all or more than the initial investment. Risk capital is money that can be lost without jeopardizing ones’ financial security or life style. Only risk capital should be used for trading and only those with sufficient risk capital should consider trading. Past performance is not necessarily indicative of future results
Hypothetical Performance Disclosure
Hypothetical performance results have many inherent limitations, some of which are described below. No representation is being made that any account will or is likely to achieve profits or losses similar to those shown; in fact, there are frequently sharp differences between hypothetical performance results and the actual results subsequently achieved by any particular trading program. One of the limitations of hypothetical performance results is that they are generally prepared with the benefit of hindsight. In addition, hypothetical trading does not involve financial risk, and no hypothetical trading record can completely account for the impact of financial risk of actual trading. for example, the ability to withstand losses or to adhere to a particular trading program in spite of trading losses are material points which can also adversely affect actual trading results. There are numerous other factors related to the markets in general or to the implementation of any specific trading program which cannot be fully accounted for in the preparation of hypothetical performance results and all which can adversely affect trading results.
Gallery images are selected historical examples for educational and illustrative purposes. They do not establish a success rate or guarantee future results.